Investing in low volatility stocks is often used as a defensive strategy by investors who want to participate in some of the market’s growth while potentially reducing their downside risk. Our research has found, however, that traditional low volatility strategies may introduce unintended sector concentration and interest rate risk, among other challenges.
In this paper, we explain how screening stocks for quality, as well as their relative volatility as measured by standard deviation, may help address those problems and create a defensive strategy that we believe offers greater upside capture and less downside risk. 1
THE HIDDEN RISKS OF LOW VOLATILITY INVESTING
 Over the years, equity investors have learned that they must accept short-term fluctuations in stock prices in pursuit of potential long-term gains. Still, for many investors it can be difficult to stay invested in equities when the value of a portfolio declines sharply during a market downturn. In response, some defensive-minded investors are including exposure to stocks with lower relative volatility in an effort to help diversify their portfolios and potentially minimize those fluctuations— giving up some upside potential during positive markets in exchange for reduced downside risk during market declines.
 Yet low volatility strategies may come with tradeoffs. They may have high portfolio turnover, as price movements can cause certain holdings to exceed targeted volatility limits. There also are risks to low volatility investing that aren’t immediately apparent. Our research suggests that traditional low volatility strategies have historically resulted in unintended sector concentration. Compounding this concen¬tration risk, some of these sectors—such as utilities and consumer staples—tend to be most negatively affected by rising interest rates. As a result, traditional low volatility strategies may provide less upside capture and less downside protection than investors anticipate.
Historical evidence reveals a potential solution: research conducted on stocks in the Russell 1000 Index2 between 1998 and 2016 found that the lowest quality stocks tended to experience higher levels of volatility. We believe this data suggests that incorporating a quality screen in a low volatility strategy may help further reduce volatility and add incremental returns.
APPLYING THE LENSES OF RELATIVE VOLATILITY AND QUALITY
The FlexShares US Quality Low Volatility Index Fund (QLV) is designed to provide exposure to US-based companies that possess lower overall absolute volatility and that also exhibit financial strength and stability, which we believe are quality characteristics.
The Fund tracks the Northern Trust Quality Low Volatility Index3 and Northern Trust Investments Inc. (NTI) is the investment adviser for FlexShares ETFs.
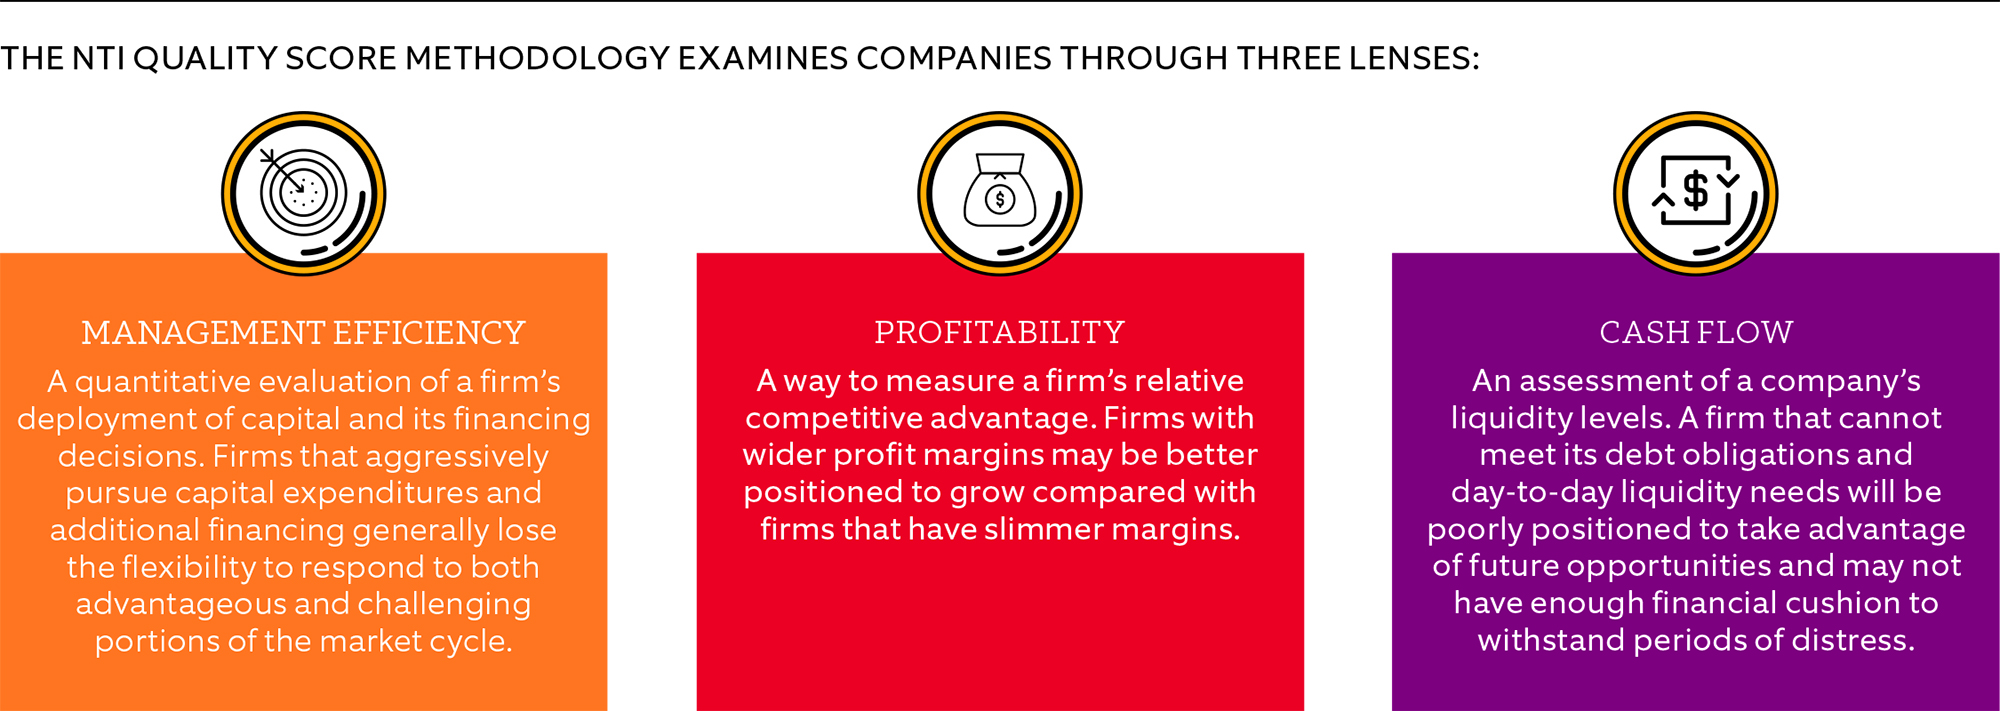
NTI starts with the Northern Trust 1250 Index4, which represents 1,250 large and mid-capitalization U.S. public companies. Then, they apply a multi-faceted Quality Score (QS) to measure a company’s core financial health.

Based on these characteristics, each company’s stock receives a quality score and is assigned to quintiles, with quintile 1 representing the highest-quality companies and quintile 5 representing the lowest. The index eliminates all stocks in quintile 5, based on evidence that low-quality companies historically have exhibited higher volatility.
Next, the index employs several rules that we believe help create a properly diversified portfolio, including maximum overweights/underweights for any single stock, industry or sector. The index also targets a portfolio of securities with a historical beta5 of 0.70%, which due to historical research suggests that the stock has been 30% less volatile than the overall market. Another rule limits portfolio turnover to 12%.
Finally, NTI optimizes the index by applying a quality tilt to the overall portfolio. This step helps confirm that there is a good representation of low-volatility stocks that also are from the higher quintiles in their respective sectors.
TARGETING IMPROVED RETURNS AND STRONGER RISK MANAGEMENT
 In our view, a good defensive strategy shouldn’t come at a greater cost than necessary to an investor’s long-term return targets. Our research suggests that using a quality screen during the index construction process may capture more of the market’s upside potential while hedging against downside risks.
CONCLUSION
Low-volatility strategies can be a helpful defensive strategy for investors who want to reduce potential portfolio declines during market downturns, while still capturing some of the gains that come during positive markets. We believe that the FlexShares US Quality Low Volatility Index Fund (QLV), which incorporates our research-driven findings about the role of quality in a stock’s potential volatility, can help investors meet their risk management and capital appreciation goals.
DEFINITIONS
Standard deviation is a measure of how dispersed the data is in relation to the mean.
FOOTNOTES
1 The up-market capture ratio is the statistical measure of an investment manager’s overall performance in up-markets. It is used to evaluate how well an investment manager performed relative to an index during periods when that index has risen. The ratio is calculated by dividing the manager’s returns by the returns of the index during the up-market and multiplying that factor by 100.
2 Russell 1000 Index is an index of approximately 1,000 of the largest companies in the U.S. equity market.
3 Northern Trust Quality Low Volatility Index tracks a portfolio of is designed to reflect the performance of a selection of companies that, in aggregate, possess lower overall absolute volatility characteristics relative to the Northern Trust 1250 Index.
4 The Northern Trust 1250 Index is designed to provide broad-based exposure to the US equity markets, with a bias towards large and mid-capitalization companies. In an effort to include a greater number of dividend-paying companies, a constituent limit of 1250 is used at the time of each annual reconstitution.
5 Historical Beta is the coefficient term of the regression of a security versus the market, and is also a measure of the systematic, non-diversifiable risk of a security or portfolio. Beta represents the market sensitivity, relative to a given market index and time period. For example, a security exhibiting a beta of 1.0 indicates that the security has the same sensitivity as the market index it is being compared to, while a security with a beta of 1.5 would indicate that the security has 1.5 times the sensitivity of the market index.
